By Paul Basha, traffic engineer, Summit Land Management
Traffic Flow Continues To Be Better. Has The Corona Virus Resulted In Significant Traffic Pattern Changes? If So, Is It Permanent?
Yes. Likely. First some historic data.
National Public Radio, Morning Edition, Marketplace Morning Report, on Wednesday 2 September, discussed this topic. They referenced the 2019 Urban Mobility Report prepared by the Texas Transportation Institute affiliated with Texas A & M University. This biennial report has examined travel data throughout the United States for decades.
The 2017 data reports that Phoenix congestion causes 62 hours of delay-per-vehicle-per-year. That’s 18th worst in the nation out of 101 metropolitan areas. We tie with Philadelphia, are two hours better than San Diego, and one hour worse than Detroit. Two hours more annual travel delay and 20 degrees cooler – easy trade? One hour less annual travel time in Detroit. Probably not worth the move.
Tucson ranks 32nd with 52 hours of annual delay-per-vehicle. Worst? Los Angeles at 119 annual delay hours and San Francisco at 103 delay hours. Best? Indio, California at 14 annual delay hours and Lancaster, California at 21 delay hours.
Phoenix travel delay costs us $1,089 dollars per-person-per-year considering fuel and time.
Based upon United States Census data, as reported by CoPilot (a company dedicated to help carbuying) people in our country commuted an average of 4.50 hours per week, prior to this year. The largest increase was just prior to the housing boom, from 2014 to 2015.
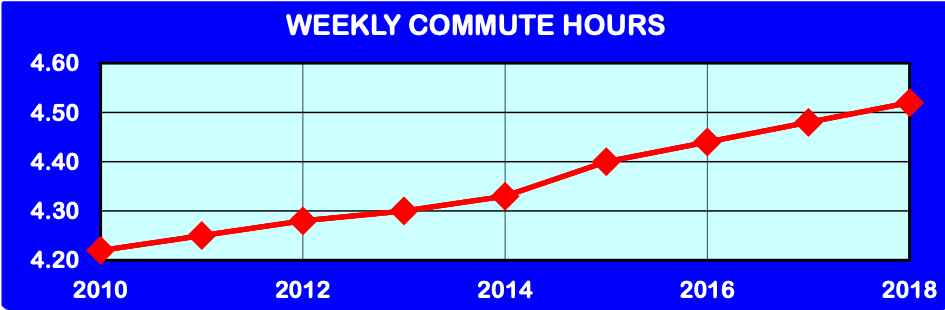
The above graph indicates a dramatic commute time increase in 8 years. Purposely deceptive. Never trust scales that start higher than zero. The increase in weekly commute time from 2014 to 2015 was only 4 minutes, a change of 1.6%. The increase in commute time from 2010 to 2018 was 18 minutes, an annual increase of only 2.25 minutes.
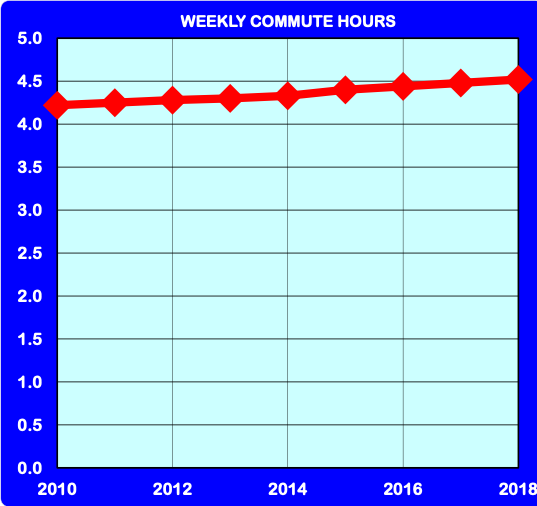
The second graph provides a more true understanding. Not much of an increase in average commute times in the United States from 2010 to 2018. Though we commuted 4.5 hours per week – prior to the corona virus pandemic.
Enough introduction.
CoPilot reports that across our nation, we are commuting approximately 10% less. The large metropolitan area with the 25th largest post-covid commute time decrease is a tie of Phoenix and New Orleans at 9.9%. New York post-covid has experienced a 15.2% decrease in commute time, from their average of 7.0 hours-per-week.
In Phoenix, our pre-virus weekly commute time was 4.3 hours, slightly less than the national average. With the virus, we’re saving approximately 26 minutes per week. Our current commute time is noticeably less than pre-2010 levels!
New York City has 22% of commuters driving alone, whereas Phoenix has 75% of commuters driving alone.
So how do we feel about this remote working? A Gallup Poll in the United States in early April revealed that 59% of workers enjoy remote working and would like to continue remote working after the pandemic. However, a Harvard Business Review survey of managers in 24 countries discovered that 60% of supervisors lack confidence in their remote workers performance. Coincidence the percentage of happy remote workers and dissatisfied remote worker supervisors is the same?
We’re driving noticeably less, thanks to the corona virus pandemic. You remote workers: earn your supervisor’s trust so these shorter commute times can continue!
Curious about something traffic? Call or e-mail Paul at (480) 505-3931 and pbasha@summitlandmgmt.com.